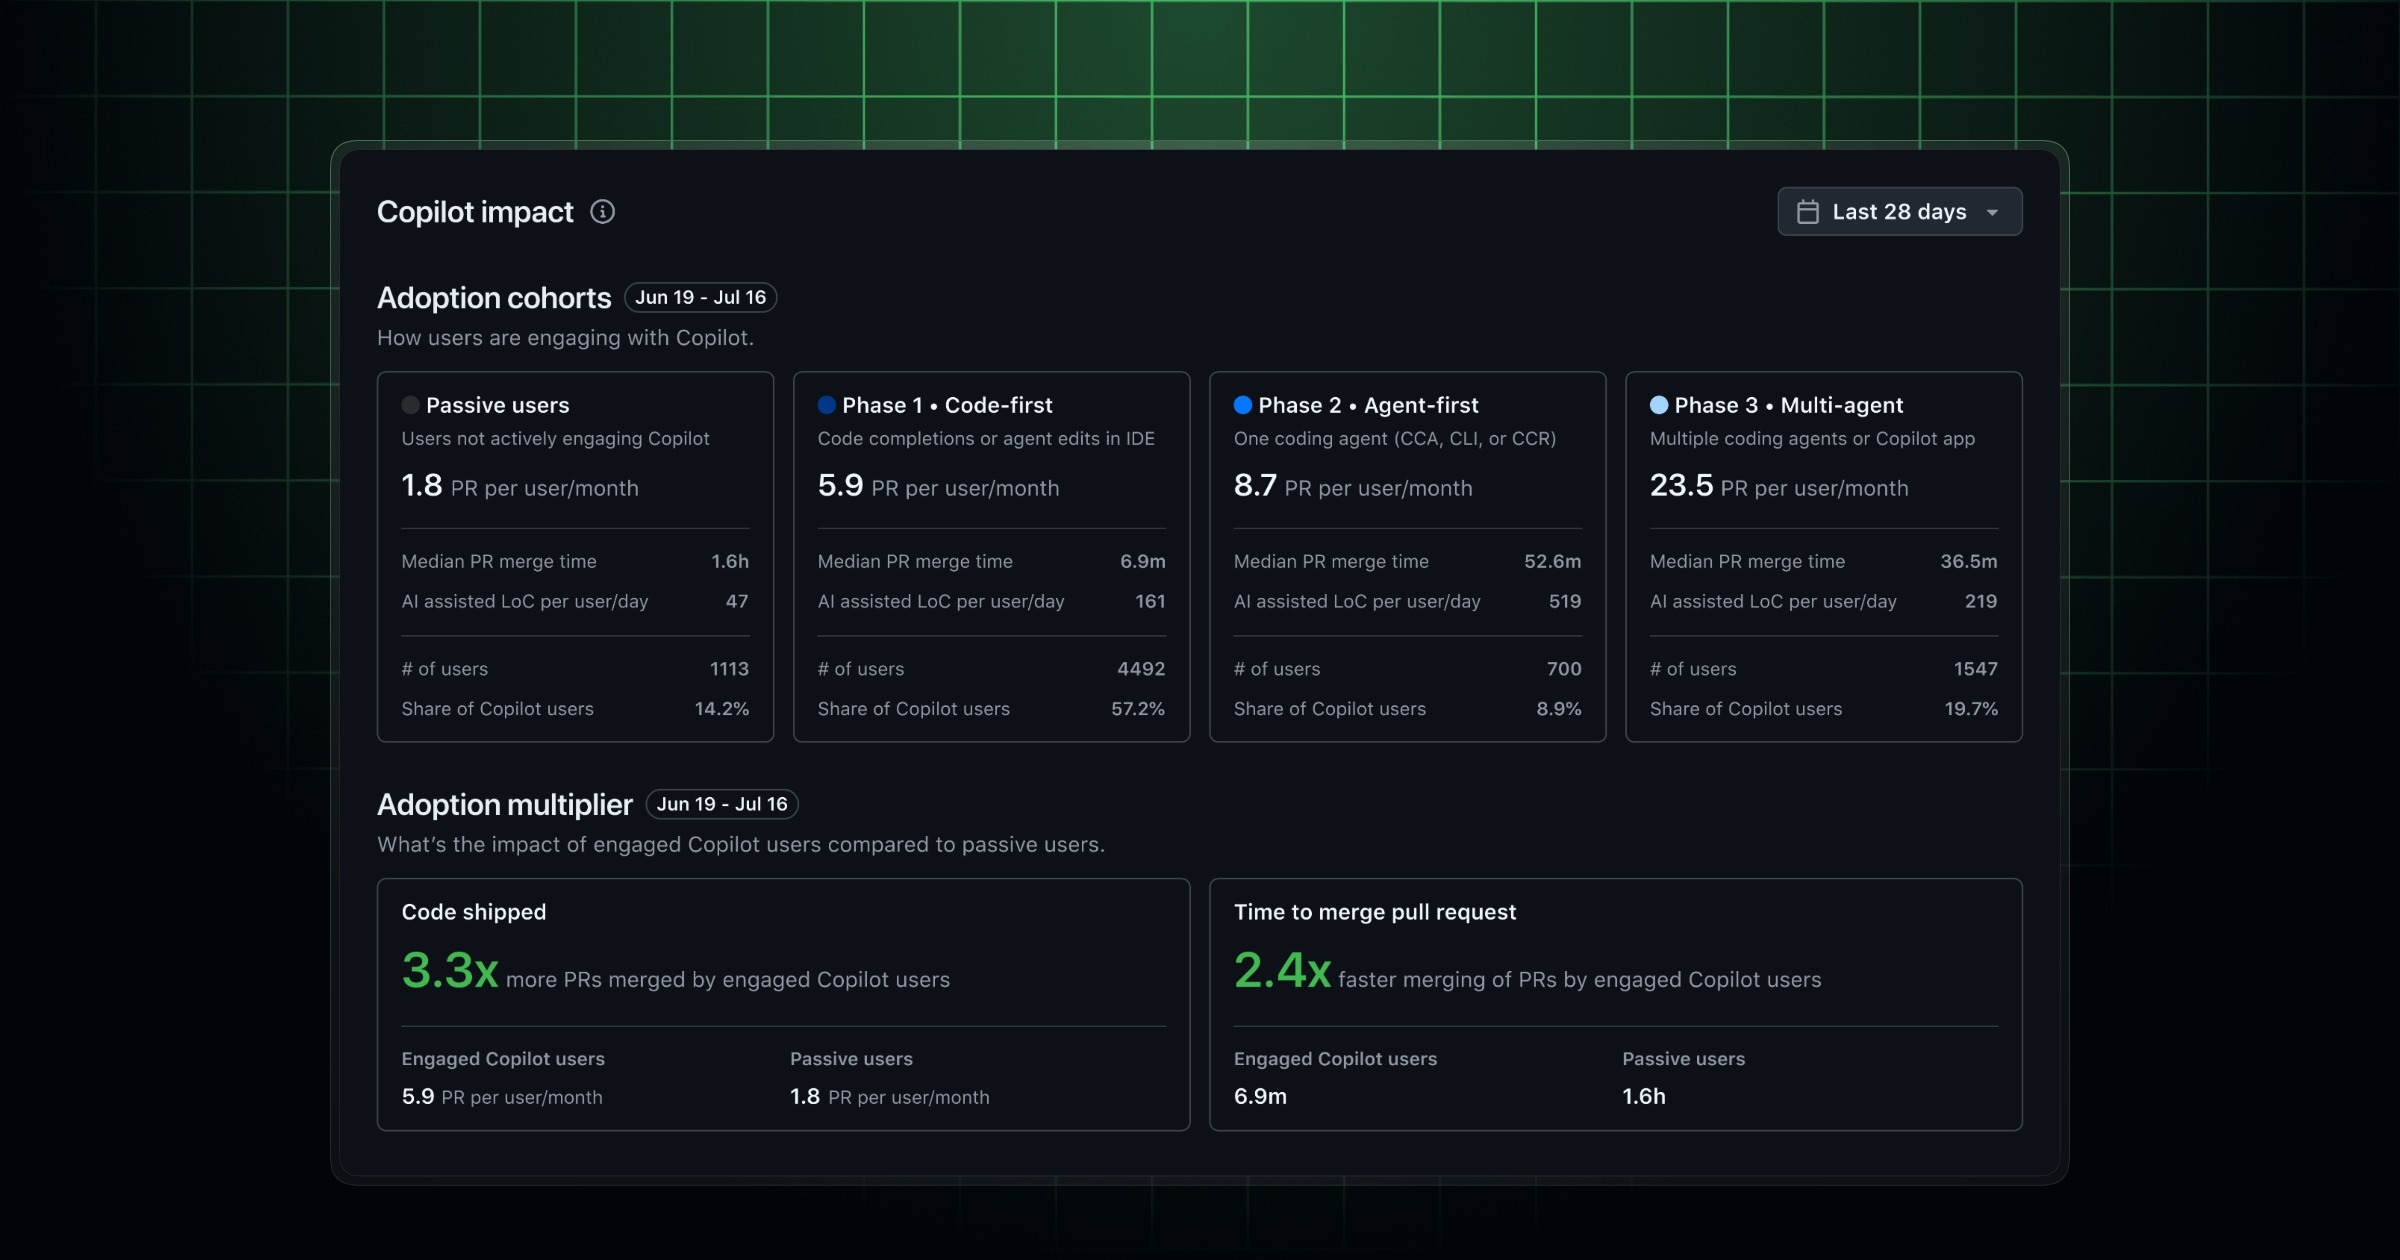
Copilot 利用状況メトリクスの影響ダッシュボードが新登場New Copilot usage metrics impact dashboard
匿名の公開いいねです。記事の保存・お気に入りではなく、Featured、Top 3、重要度、掲載順位には影響しません。仕組みとプライバシーAnonymous public likes are reactions, not saved articles or bookmarks. They do not affect Featured, Top 3, importance, or listing order.How it works and privacy
- GitHub Copilot の管理画面に、利用状況と開発生産性への影響を可視化する新しいダッシュボードが追加された。
- 組織はこれにより Copilot の導入効果をデータで把握しやすくなる。
GitHub introduced a new impact dashboard for Copilot usage metrics, giving organizations clearer visibility into how Copilot adoption affects developer productivity and workflow efficiency.
本ページの本文と要約は AI による自動生成です。日本語版と英語版は言語ごとに独立して生成されるため、表現や詳しさが異なる場合があります。正確性は元記事 (github.blog) をご確認ください。The body and summaries are AI-generated independently for each language, so wording and detail may differ. Verify accuracy at the original source (github.blog).
要約と収集メタデータに基づく AI 解説。元記事全文の転載・翻訳ではありません。AI explainer based on the summaries and collected metadata, not a copy or translation of the full source article.
GitHub は、Copilot の管理画面に利用状況と開発生産性への影響を可視化する新しい「影響ダッシュボード(impact dashboard)」を追加した。組織が Copilot の導入効果をデータに基づいて把握しやすくすることを狙ったもので、AI コーディング支援ツールの費用対効果を評価したいと考える企業にとって注目度の高い機能追加といえる。
今回のダッシュボードは、Copilot for Business や Copilot Enterprise を利用する組織の管理者向けに提供される。従来から GitHub は、コード補完の提案数や受け入れ率、アクティブユーザー数といった基本的な利用状況メトリクスを API やレポートを通じて提供してきた。新しいダッシュボードはこうした指標を発展させ、利用状況と開発ワークフローの効率性や生産性への影響をより明確に結び付けて表示すると説明されている。
背景には、生成 AI を用いた開発支援ツールの導入が急速に広がる一方で、その効果を定量的に測る手段が確立されていないという課題がある。多くの組織にとって、Copilot のライセンス費用に見合う成果が出ているかを客観的に示すことは容易ではなく、経営層への説明材料が不足しがちだった。影響ダッシュボードは、こうした効果測定のニーズに応える取り組みの一環と位置付けられる。
生産性の可視化をめぐっては、業界全体でも関心が高まっている。開発チームの状態を計測する枠組みとしては、DevOps 分野の DORA メトリクスや、より包括的な SPACE フレームワークなどが知られており、AI ツールの評価にこれらの考え方を応用しようとする動きもある。GitHub 以外でも、各種の開発分析プラットフォームが AI 利用の効果測定機能を強化しつつあり、Copilot のダッシュボード拡充もこうした流れに沿ったものと見られる。
ただし、コード提案の受け入れ率などの指標が必ずしも実際の生産性向上と一致するとは限らない点には留意が必要だろう。指標をどう解釈し、開発現場の実態と照らし合わせて活用するかは、各組織の運用に委ねられる部分が大きい。利用状況の可視化が進むことで、AI 支援ツールの導入判断や運用改善に向けた議論が、より具体的なデータに基づいて行われるようになる可能性がある。
GitHub has added a new impact dashboard to the administrative tools for Copilot, giving organizations a consolidated view of how the AI coding assistant is being used and how that usage relates to developer productivity and workflow efficiency. The change matters because it targets one of the most persistent questions facing engineering leaders who have purchased Copilot at scale: whether license spending produces measurable effects on how teams actually work, rather than remaining an assumption.
According to the changelog entry, the dashboard sits within the Copilot management surface available to organizations and enterprises on the Copilot for Business tier. It is designed to move beyond raw activity counts toward a picture of impact, pairing adoption signals with indicators intended to reflect efficiency in day-to-day development. In practice, dashboards of this kind typically surface metrics such as the number of active and engaged users, seat utilization, suggestion acceptance rates, chat interactions, and a breakdown of which features and languages see the most use. The stated goal is to help administrators understand not just that Copilot is switched on, but how deeply it is woven into a team's workflow.
This release appears to build on GitHub's earlier investments in Copilot analytics. The company previously shipped a Copilot metrics API and usage reporting that allowed organizations to pull adoption data programmatically or view it in the admin console. An impact-oriented dashboard is a logical extension of that groundwork, packaging the underlying data into a view that is easier for non-technical stakeholders, such as engineering managers and finance teams, to interpret. Organizations that want to combine Copilot data with their own internal systems can generally still rely on the API, while the dashboard offers a faster path for those who prefer a ready-made interface.
Measuring the effect of AI coding tools is notoriously difficult, and that context is worth keeping in mind. Suggestion acceptance rates and lines of code generated are convenient to capture but are imperfect proxies for genuine productivity, since accepted code is not always retained, and volume of output does not necessarily equal value. Industry frameworks such as DORA, which tracks metrics like deployment frequency and lead time for changes, and the SPACE framework, which emphasizes satisfaction, performance, activity, communication, and efficiency, have emerged precisely because single numbers can mislead. A dashboard that aggregates several signals is likely more useful than any one metric, but organizations will still need to interpret the data alongside their own delivery outcomes and developer feedback rather than treating it as a definitive productivity score.
Privacy and governance are relevant considerations as well. Usage analytics of this nature generally report on aggregated or de-identified activity to avoid turning the tool into a means of individual surveillance, and administrators typically face access controls and minimum-threshold requirements before data is shown. Companies adopting the dashboard will want to confirm how granular the reporting is and communicate clearly with engineering teams about what is being measured, since perceptions of monitoring can affect trust and, ironically, the very productivity such tools aim to improve.
The move also fits a broader competitive backdrop. Rival assistants, including Amazon's Q Developer, offerings built on Anthropic's and OpenAI's models, and tools such as Cursor and Tabnine, have pushed vendors to demonstrate return on investment as enterprises scrutinize AI budgets. Visibility into adoption has become a selling point in its own right, because procurement decisions increasingly hinge on evidence rather than promise. By giving customers clearer reporting, GitHub is responding to buyers who want to justify renewals and expansions with data.
For organizations already running Copilot, the practical next step is to review the dashboard within the admin settings and consider how its figures map to existing engineering metrics. The feature does not, on its own, prove that Copilot improves outcomes, and results are likely to vary by team, codebase, and workflow. What it does provide is a more structured starting point for that evaluation, lowering the effort required to track adoption trends over time and to identify where usage is strong or lagging across an organization.
ポコとTECHガイドPoko & TECH Guide
ポコと当サイトのTECHガイドが、記事の要約と収集した情報から読みどころを語るAI生成の対話です。Poko and TECH Dashboard's own TECH Guide discuss the article's highlights in an AI-generated conversation based on its summary and collected source details.
- ポコPoko新しい「影響ダッシュボード」って何? Copilotを使った回数が見えるだけなの?What’s this new “impact dashboard”? Does it just show how often people use Copilot?
- TECHガイドTECH Guide記事によれば、利用状況だけでなく、開発の生産性や作業効率への影響も見やすくする管理画面じゃよ。According to the article, it shows more than usage. It helps admins see Copilot’s impact on developer productivity and workflow efficiency.
- ポコPokoへえ、それって組織にとって何が嬉しいの?Oh, nice! What does that actually help an organization understand?
- TECHガイドTECH Guide簡単に言うとじゃな、Copilotの導入効果を感覚だけでなく、メトリクス、つまり数値の指標で把握しやすくなるんじゃ。Simply put, it makes Copilot’s impact easier to understand through metrics—numerical indicators—rather than relying only on impressions.
- ポコPokoつまり、Copilotがどれくらい使われ、仕事にどう影響しているかを一つの画面で見やすくしたんだね!So it puts Copilot usage and its impact on work into one clearer view. Got it!
- TECHガイドTECH Guideその通りじゃ。記事では企業管理者と組織オーナー向けとされており、導入効果をどこまで明確に捉えられるかが見どころじゃな。Exactly. The article says it’s for enterprise admins and organization owners; the key will be how clearly it helps them understand adoption’s impact.